
National Health Spending Just Hit $5.7 Trillion: What That Means for Your Self-Funded Plan
By Jude Odu
June 29, 2026
This week, CMS released its national health expenditure data for 2025, and the journal Health Affairs published the analysis. The U.S. spent $5.7 trillion on health care last year, a 7.3% increase over 2024. That works out to almost $16,500 per person. Health care now consumes 18.4% of the entire economy, and the country is on pace to cross $6 trillion in 2026. The headlines will focus on the total. The real story though is in what that total funds.
The Number Confirms the Waste Math
When I wrote Model Optimal Care: End U.S. Healthcare Waste, One Health Plan at a Time, I projected 2025 spending at roughly $5.6 trillion. The actual figure came in higher. That is not a small detail. The book estimates that $760 billion to $1.6 trillion of national health spending is waste, a range drawn from the landmark 2019 JAMA study by Shrank, Rogstad, and Parekh and updated against then current CMS data. When the denominator grows, the waste pile grows with it. At $5.7 trillion, the top of that range now sits even higher than the book projected.
This is the part most coverage misses. A 7.3% spending increase is not simply the cost of more care. Roughly 25 to 30 cents of every dollar in that total goes to billing errors, administrative complexity, unnecessary services, pricing failures, and fraud. The system did not just get more expensive last year. It got more wasteful in absolute terms.
Drugs Led the Surge, and The Finger Points Straight at Your PBM
Prescription drugs were the fastest-growing category in the CMS data, rising 11%. GLP-1 weight loss drugs drove much of it. Those drugs alone reached about 10.5% of employer health claims in 2025, up from 8.9% the year before, at an annual cost of roughly $12,000 to $17,000 per patient before rebates.
Here is what the drug number exposes. Brand-name drugs account for about 80% of all drug spending, while generics make up 80% of prescriptions filled. That gap is where your money leaks. The three largest pharmacy benefit managers process nearly 80% of U.S. prescriptions, and the FTC found they marked up specialty generic drugs by thousands of percent, generating $7.3 billion in excess revenue between 2017 and 2022. If you run a self-funded plan and you have never examined your pharmacy claims at the line-item level, you are paying for that markup without seeing it.
The Pricing Problem Is Just as Large
Drugs are only half the story. Pricing failure is one of the six waste categories JAMA identified, and it is among the biggest. An echocardiogram can cost $350 at one facility and $2,700 at another in the same market, with no difference in quality. The primary driver of high U.S. spending is price, not volume. Americans often use fewer services than peers in other wealthy countries and still pay far more for each one. That pattern repeats in nearly every health plan I have analyzed over the past decade.
Why This Is Your Problem to Solve
Self-insured employers cover more than 160 million Americans. About 67% of insured U.S. workers are now in self-funded plans. If you sponsor one of those plans, this spending is your money, and under ERISA and the CAA, you carry the fiduciary duty to manage it prudently. That duty is no longer theoretical. Large employers are already facing ERISA class action lawsuits over alleged PBM mismanagement. A regulator or a plaintiff can now point to public benchmarks and ask why your plan paid more. Will you have an answer?
The encouraging part is that this waste is measurable. It is not invisible once you look. My internal analyses of self-funded plans from 2014 to 2024 show that up to 50 cents of every claims dollar can be classified as wasteful or inefficiently spent. Researchers have already quantified $191 billion to $282 billion in recoverable savings each year using interventions that exist today.
What to Do This Quarter
Start with your pharmacy spend, since that is where the 11% surge landed. Pull your net cost per unit on your top 25 drugs after all rebates and fees, and compare it against public benchmarks. Then look at your high-cost imaging and procedures and test for the kind of price variation that has no clinical justification. Read your PBM contract for the audit rights the CAA now guarantees, and schedule the audit with a reviewer you choose, not one the PBM selects.
The $5.7 trillion number is more than a national statistic. It is the sum of millions of claims, and a large share of yours is recoverable. Your job is to find your portion of the waste, document it, and make your vendors explain the gap. I suggest you start that process soonest.
—
More about this topic can be explored in the book, Model Optimal Care: End U.S. Healthcare Waste, One Health Plan at a Time.
get Moc Insights
Get the latest healthcare policy analysis for self-insured professionals and healthcare leaders committed to eliminating waste and optimizing care delivery.
About the author

Jude Odu
Founder of Health Cost IQ and author of Model Optimal Care. 25+ years in healthcare technology.
Categories
The Book
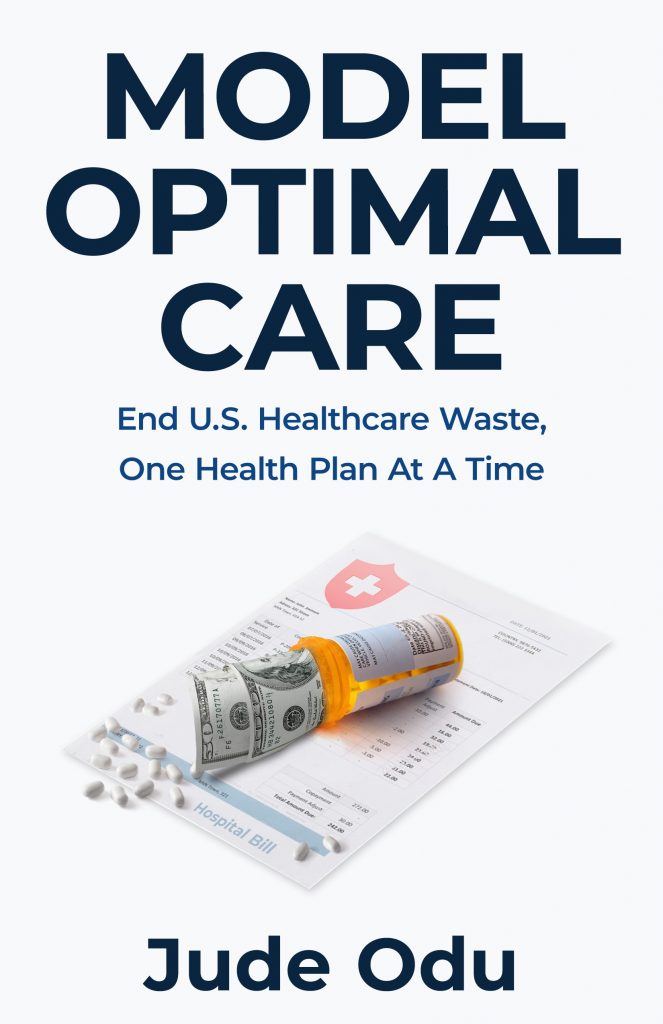
The definitive guide to ending U.S. healthcare waste. One health plan at a time.